Java in K8s: how we’ve reduced memory usage without changing any code
This article has been originally published on Medium
This article has been written by Cédric Nisio and Mickael Jeanroy (Cédric Nisio and Mickael Jeanroy on Medium). This is the story of a memory usage analysis that took us, more or less, three months (January -> March)!
A long time ago, in a cluster far, far away…
At the very beginning of Malt, our applications were hosted by OVH, but in 2019, we migrated our entire infrastructure to Google Cloud Platform, specifically to Google Kubernetes Engine.
After the migration had been done, we started to face memory issues on our applications. Strangely, the native memory usage increased a lot, and started to grow over and over as you can see on this graph:
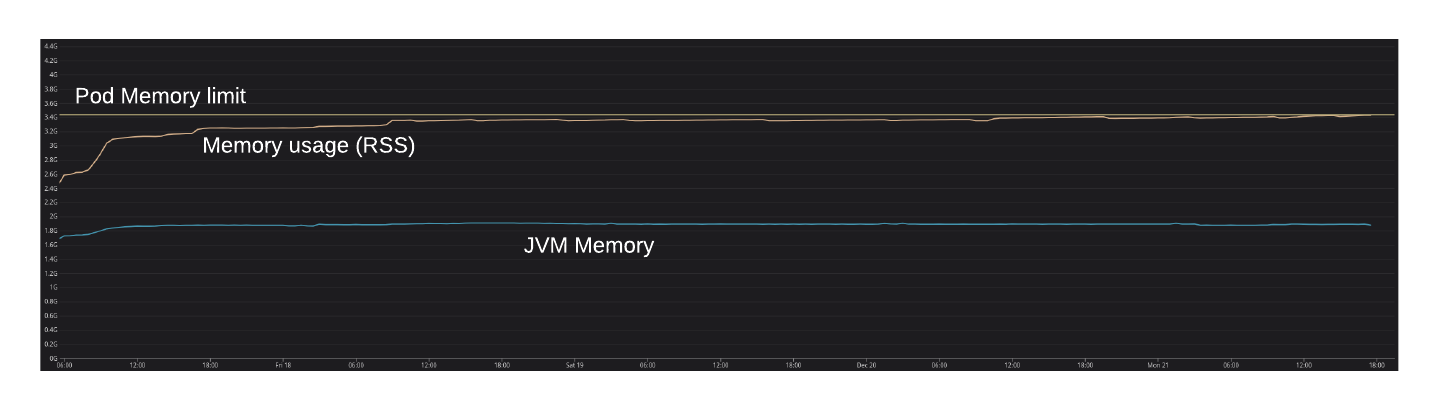
Here is a brief explanation of what you see in this graph:
- The blue line is the memory usage seen by the JVM (Heap, Metaspace, etc., you will find more information in the next section).
- The orange line (the one increasing over and over) is the memory usage seen by the OS (Resident Set Size)
- The yellow line (on the top of the graph) is the memory limit before an OOMKill is triggered by Kubernetes
The main questions that arose were:
- Why the hell is memory usage only increasing while heap initial and max size are equal?
- Why do all our java application pods get OOMKilled eventually even with resource limit set to twice the heap size?
To understand what happened here, let’s dive into JVM native memory allocations (for what it’s worth, we used Java 8 at the time of the GCP migration, we’re now using Java 11).
Back to basics
JVM Native memory is basically all the memory the JVM holds at OS level. When using your preferred command line tool to check the java process resource consumption, it is the value you can find under what is called “Resident Set Size” (a.k.a RSS).
The JVM allocates multiple memory areas for different purposes (note all these arena corresponds to the blue line that we saw in the previous graph):
- Heap size, limited by
-Xmx - Metaspace, limited by
-XX:MaxMetaspaceSize= - Thread stacks, stack size (
-Xss) times the number of threads - DirectMemory, limited by
-XX:MaxDirectMemorySize - CodeCache, limited by
-XX:ReservedCodeCacheSize - GC and Symbols that we won’t discuss here
At this point, we’ve tried many things to optimize memory:
- We enabled Java Native Memory Tracking (NMT) and analyzed GC logs to investigate about native memory leaks, without success.
- We tuned the amount of memory to be given to a pod (resource request/limit).
- We’ve tuned how much of that memory should go to the java heap (
Xms/Xmx), - We’ve tried different Garbage Collectors (G1/GC, Shenandoah, etc.): we observed that Shenandoah was pretty good, and actually, it did reduce the native memory usage, but it did not solve our issue in the long run.
Unfortunately nothing came out. The different areas seemed not to grow, so where was the memory going?!
After months, we (especially Cédric) decided to try alternatives.
Let’s try jemalloc
Basically the OS was telling us the java process was eating the memory… But the JVM told us it was not using that much. So which one lied? What if they were both telling the truth?
To figure it out we’ve used a great tool: jemalloc. Without going too deep, this is an implementation of malloc that comes with tools to profile an application memory allocations, and it replaces the malloc implementation from glibc.
We waited for a week or so, and the results were unexpected: the problem just disappeared, as you can see in the following graph:
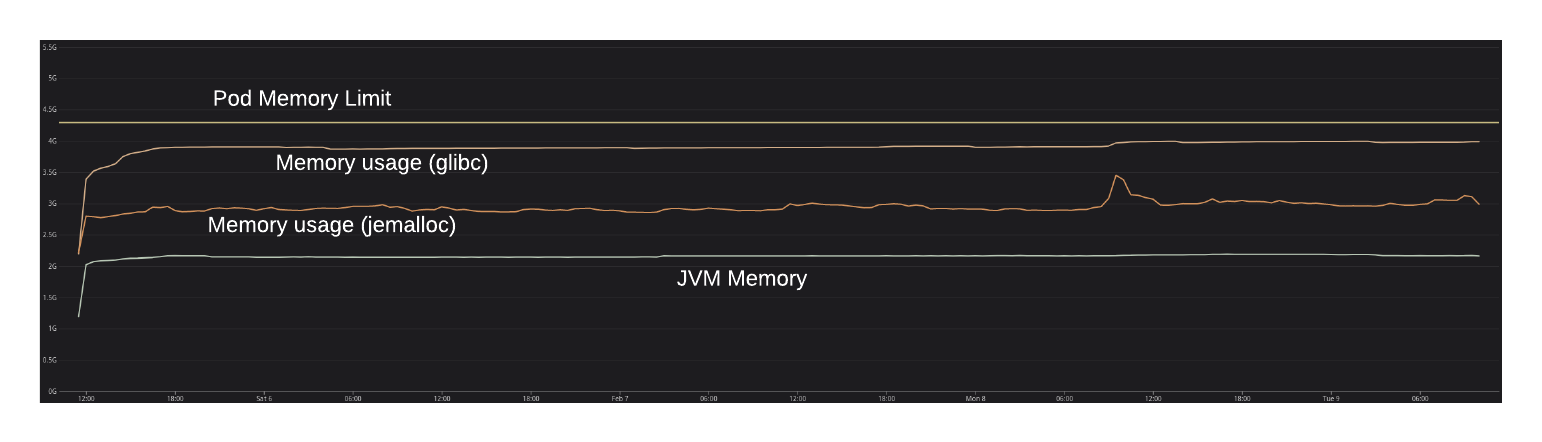
In contrast to glibc’s malloc, it seemed that jemalloc was able to return memory to the OS. Why would that be?
Looking at jemalloc.net:
jemalloc is a general purpose malloc(3) implementation that emphasizes fragmentation avoidance and scalable concurrency support.
Jemalloc says it limits memory fragmentation. So if that was our problem, what could cause it? That’s the question we attempted to answer during the last three months.
First Experimentation: tuning the thread stack
Most of our applications use Spring Boot with an embedded Tomcat server, so they are creating and recycling threads every now and then. These threads’ stacks were probably reallocated quite often. Our assumption at this point was that the memory allocated to these threads were not returned to the OS as expected, causing huge memory fragmentation.
In January, we tried to set a fixed number of threads (min == max) for Tomcat so it would reuse the same threads instead of reallocating them. After some weeks, the results were disappointing: it had strictly no effect on memory usage.
So, we decided to give up with that and we focused on the memory allocator.
Second Experimentation: going deeper with malloc
The default memory allocator on Linux is provided by glibc and uses what is called “memory arena”. Basically, each time malloc needs to allocate memory, it will use an arena.
Before going too deep in the malloc internals, we need to define some terms that are used in this post (you can find them on the glibc documentation here):
Arena: A structure that is shared among one or more threads which contains references to one or more heaps, as well as linked lists of chunks within those heaps which are “free”. Threads assigned to each arena will allocate memory from that arena’s free lists.Heap: A contiguous region of memory that is subdivided into chunks to be allocated. Each heap belongs to exactly one arena.Chunk: A small range of memory that can be allocated (owned by the application), freed (owned by glibc), or combined with adjacent chunks into larger ranges. Note that a chunk is a wrapper around the block of memory that is given to the application. Each chunk exists in one heap and belongs to one arena.
To resume: chunk of memories are allocated by the application, but are freed by glibc. It was clear at this point that we needed to understand how glibc frees memory and returns it to the OS.
When malloc wants to allocate memory, it needs to find a free chunk in an arena.
What is important here is that malloc will always free memory from the top of the heap: it means that if a chunk has to be freed but it isn’t at the top of the heap, it won’t be released at the OS level (you can see it here how an arena is trimmed in the glibc source code, take a look at the linked list traversal in reverse order).
Let’s illustrate that with an example (note that in this schema, we use the term “memory arena”, but strictly speaking, this is a view of a heap in an arena. To simplify, let’s assume this arena contains one heap):
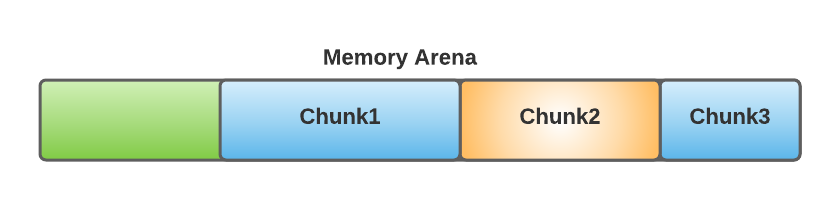
- Suppose that the application allocated three chunks of memory in this order:
Chunk1 -> Chunk2 -> Chunk3. - Now, suppose that the
Chunk2is freed by malloc: in fact that memory will only be released at the OS level onceChunk3is freed! - Note that when a chunk at the top of the arena is released, malloc is smart enough and attempts to move some chunks to the top of the arena in order to reduce fragmentation, but that does not solve our main problem (again, see it here in the glibc source code).
To remain efficient in a highly concurrent system, multiple arenas are used:
- If a thread needs to allocate a new chunk of memory, malloc will lock an arena to allocate memory (you can see it here in the malloc source code).
- If an arena is locked, it will try with another arena, and so on…
- If all arenas are locked, it must wait for an arena to become usable.
The default number of arenas in glibc is set to 8 * nb of CPU. In our case at Malt, we use 8 CPU, it means that by default we use 8 * 8 = 64 arenas. Regarding the fragmentation issues that may occur in one arena, it can become a huge issue with 64 arenas!
What is interesting here is that jemalloc does not use the same default, instead it is set to 4 * nb of CPU, in our case 4 * 8 = 32. That is a big difference, so our second experimentation in February has been to reduce the number of arenas using the MALLOC_ARENA_MAX parameter.
Tuning malloc arena parameter
According to lot of posts out there(on Stack Overflow, GitHub, other, etc.), a common optimization is to fix the number of arenas to 2 or 4, depending on the context (note that using only one arena is only interesting in a single-threaded application, that is obviously not our context).
At this point, we decided to take four applications in our infrastructure and split our experimentation into two groups:
- pods with glibc malloc implementation configured with 2 arenas
- pods with
jemallocalso configured with 2 arenas
We did not changed the settings of the other applications, so that we could monitor, measure and compare the memory usage across all of our infrastructure.
After 3 weeks or so (first, by experimenting on our staging environment, then directly in production), we checked the results and they were really interesting:
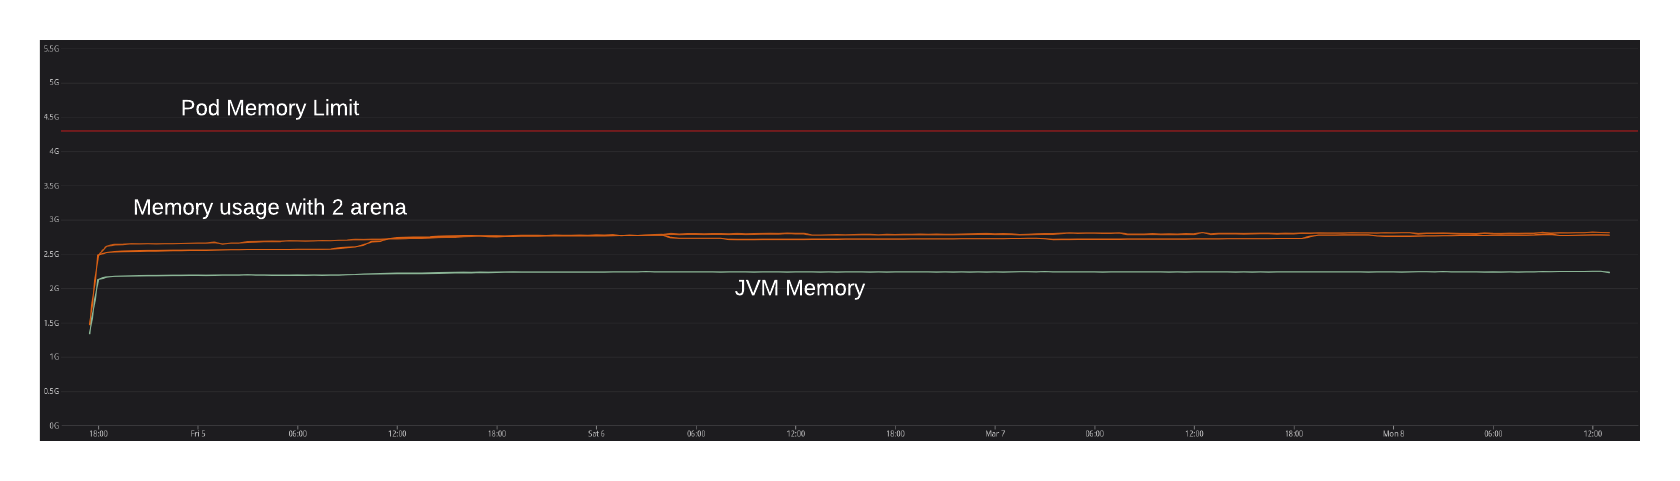
After this new experimentation, we came to the following conclusions:
- Setting the number of arenas to 2 in the glibc configuration drastically reduced the native memory usage… In fact, we almost did not have any OOMKill during this experimentation!
- With the same number of arenas in
glibcandjemalloc, we noticed that the memory usage with jemalloc is still a bit lower that with the glibc implementation (that’s not really a surprise, sincejemallocperforms really well to reduce memory fragmentation). - Note that on the graph below, the memory usage is really similar with glibc and jemalloc, but on other applications, jemalloc was really better than glibc.
With these conclusions, we decided to use jemalloc everywhere (as before: first on our staging environment, then in production).
Last Experimentation: let’s try TCMalloc
After this experimentation, a former colleague (Thomas Bracher) shared a great post from Cloudflare about exactly our investigations for the last two months (this is really a great post, you should read it!).
What was interesting in this post is that:
- We came to, more or less, the same analysis / conclusion
- Cloudflare chose
TCMallocas an alternative malloc implementation (they don’t talk much aboutjemalloc, but we can be pretty sure they tested it rigorously).
So, we decided to give TCMalloc a try 🔥
As in our previous experimentation, we split our tests into two groups:
- Run some pods with
jemalloc(still using 2 arenas) - Run other pods with
TCMalloc
After 3 weeks, we were ready to check the results:
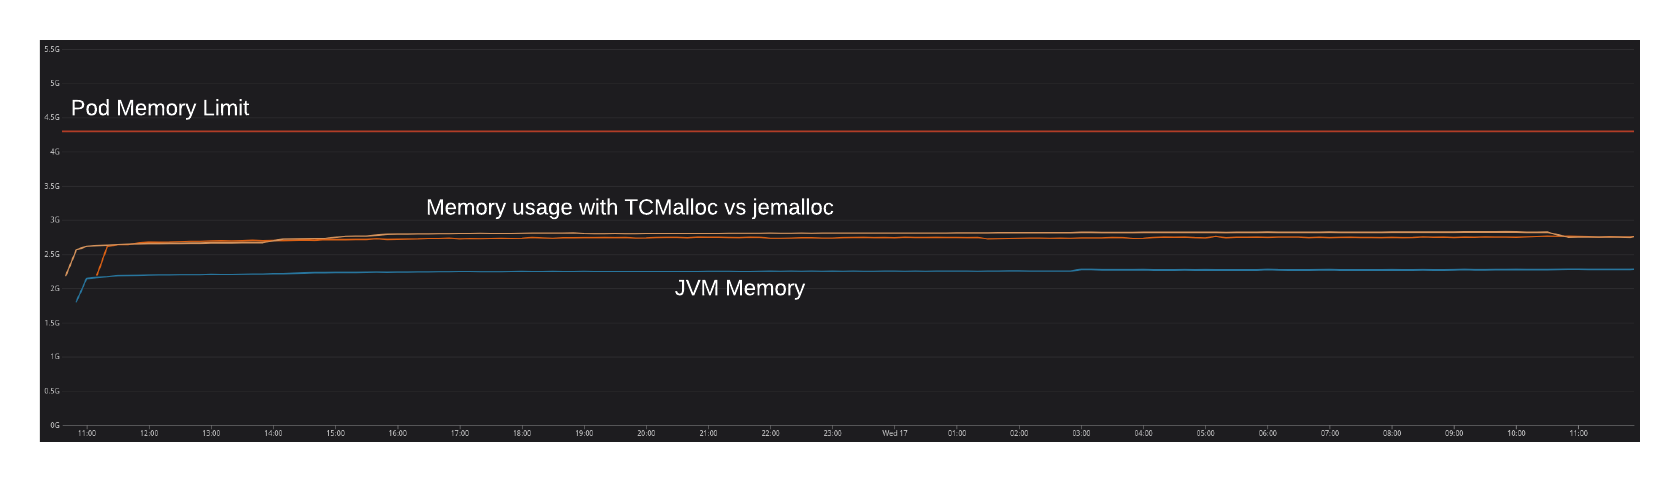
And we came to those conclusions:
TCMallocperforms really well: our memory usage follow (more or less) the same “behavior” thanjemallocand native memory is returned to the OS periodically.- Memory usage is still lower with
jemalloc. Not so much, but enough to choosejemallocin the end! Fun fact:TCMallocalso uses some kind of garbage collector to release memory to the OS periodically(you see that in the previous graph when the memory usage decrease) 😃
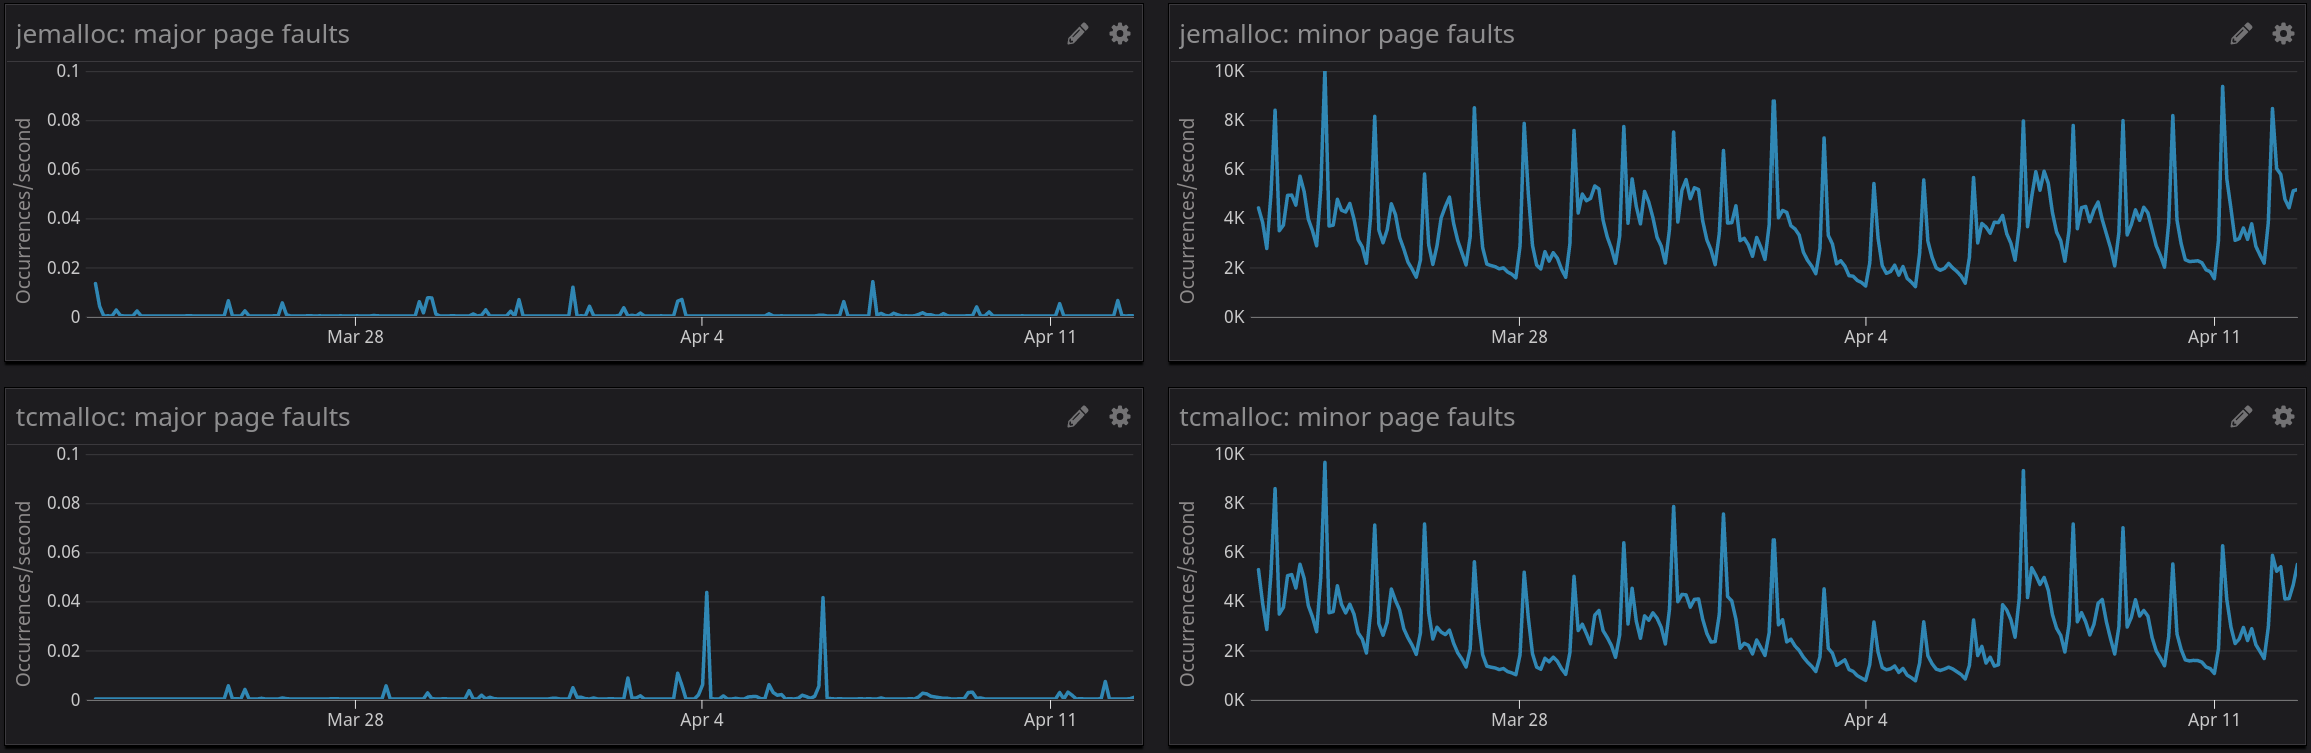
We also took the time to monitor other metrics between TCMalloc and jemalloc, such as page faults (major and minor), but results were quite the same, as you can see in the following graph:
Conclusion
This investigation was really amazing: we did not expect these results at all!
Nevertheless, it took us almost three months to conclude that jemalloc was the right choice in our context. Please, note that it did not took us a “lot of time” (approximately one or two hours per week), but measuring the effect of a memory allocation requires a long period of executions (nothing can be concluded after only a couple of days!).
For those who read this article, please do not switch your production infrastructure to jemalloc without measuring and monitoring. What we concluded at Malt will not necessarily be true in your context.
Conclusion from Mickael: It was really a pleasure to work with Cédric on that, he’s an awesome software engineer who takes decision based on facts, not feelings (and it is a mandatory skill in this kind of analysis). I am grateful to him that he proposed me to work on this subject, I hope I’ll be able to do these kinds of analysis with him in the future (and to be honest, I’ll miss our weekly zoom about memory analysis)! ❤️